Chemical and Sensory Differences in American Oak Toasting Profiles
John Cole, Kendall-Jackson
Chris Johnson, Kendall-Jackson
Marcia Monahan, Kendall-Jackson
David Llodrá, World Cooperage
Dr. James Swan, Consultant
Abstract
The objective of this experiment was to compare different American oak profiles in the same wine. Every profile used the same wood lot and seasoning time, was air dried in the same yard, and was processed under similar conditions. Each profile had four barrels made at the Missouri cooperage. The toast monitoring system, known as Barrel Profiling Technology, used by World Cooperage insures that all barrels of the same profile were made maintaining a similar average temperature during the toasting process, with an acceptable tolerance for error shown later in a plot of the mean for the curve and the Standard Deviations. The objective was to maintain all variables as fixed as possible, with the exception of the toasting curve, to evaluate the effects of the toasting. Thus, the same wine lot was divided among all the barrels after malolactic fermentation, with barrel ageing of about 10 months. All samples were bottled at the same time to reduce variation.
The findings in this report may be summarized as follows:
- Preference testing by the Kendall-Jackson sensory panel listed the preferred profiles negatively correlated to smoke and positively correlated to fruit.
- The sensory results from the 3-way ANOVA study confirmed that only fruit and smoke were statistically significant at the 5% level. Since the control sample was the highest in fruit and the lowest in smoke, this further confirms that the panel can detect the differences for these attributes.
- The PLS (Partial Least Squares) results indicated a positive correlation of preference with fruit, so more fruit was preferred by the panel, and a negative correlation with smoke.
- Analysis of the toasting profile data plots shows a strong correlation with smoke characters when toasting temperatures exceed 400 degrees Fahrenheit for an extended period of time. By contrast, there is a strong correlation with fruit character when the toasting temperatures do not exceed 400 degrees Fahrenheit for an extended period of time.
- Most of the wines from the profiled barrels contained more than enough vanillin to influence the wine flavor.
- The wines (and hence toasting profiles) tended to split into two groups. One group, the right-hand side profiles, was characterized by:
- Adequate vanillin
- Generous levels of toasted oak character
- Spice character
- By contrast the left-hand side profiles were characterized by:
- Higher levels of oak lactones
- Higher levels of smoke
The strongest argument that can be made for the technique of temperature-time profiling is the ability to create profiles that will be attractive to all winemakers as they may customize based on desired wine style or blending component. This study of American oak profiles clearly demonstrates that capability.
Introduction
In the past three years several new profiles in American oak have been developed at World Cooperage with the purpose of making more elegant barrels from this oak type. The newer profiles are normally toasted for longer time periods at slightly higher temperatures, resulting in larger differences to the initial American oak profiles.
In this experiment, a Cabernet Sauvignon wine from 2005 vintage was studied in 18 different American oak barrel profiles made by World Cooperage from the same lot of wood and a control set of used 2002 barrels. There were four barrels of each profile and 52 barrels of the control.
Composite samples from each barrel type have been analyzed for 27 oak extractives and selected wine phenolics. The samples also underwent a comprehensive sensory evaluation with four repetitions using the following sensory attributes: vanilla, smoke, fruit, toast and spice, and preference testing.
The Wine
Producer: Kendall-Jackson Wine Estates, Oakville Winery
Year: 2005
Variety: Cabernet Sauvignon
Vineyard: Kellogg (Knight’s Valley)
Crush Date: 10/08/2005
Harvest Data
- Total Acidity: 3.5 g/L (titratable acidity)
- Brix: 24.9
- pH: 3.73
- Prior to fermentation, added:
- Sulfur Dioxide (6% solution – 50 ppm)
- Days of fermentation: 16
- Fermented with: Fermirouge
- During fermentation, added: 150 ppm NH3 by DAP, 1#/Kgal Superfood
Wine Analysis as of 11/2006
- Alcohol: 15.3
- Total Acidity: 0.57 g/100 mL
- Volatile Acidity: 0.068 g/100 mL
- Free Sulfur Dioxide: 35 ppm
- Total Sulfur Dioxide: 77 ppm
- pH: 3.75
- Residual Sugar: 0.03 g/100 mL
Oak Data
Source: American oak
Trial Execution
Sample Size: 4 barrels per variable
Oak Contact Time: 10 months
Bottling Date: 12/22/2006
The Trial
Control
Profile 10
Profile 11
Profile 23
Profile 25
Profile 33
Profile 34
Profile 35
Profile 36
Profile 37
Profile 38
Profile 47
Profile 48
Profile 49
Profile 50
Profile 51
Profile 52
Profile 61
Profile 63
Results and Discussion
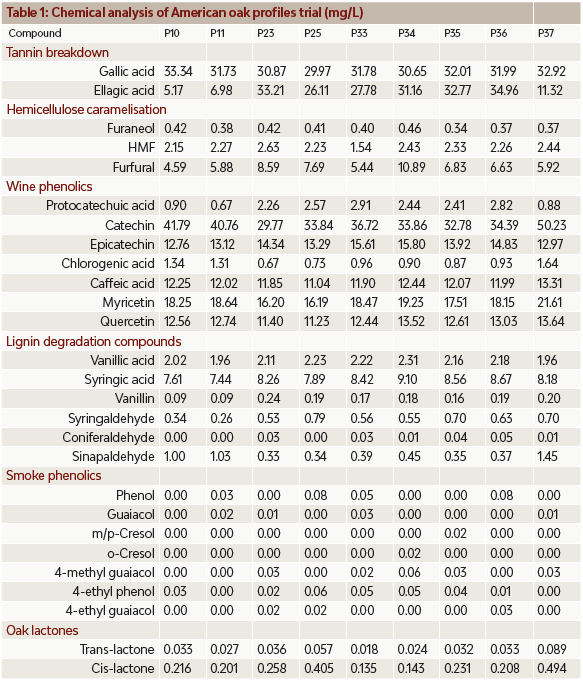
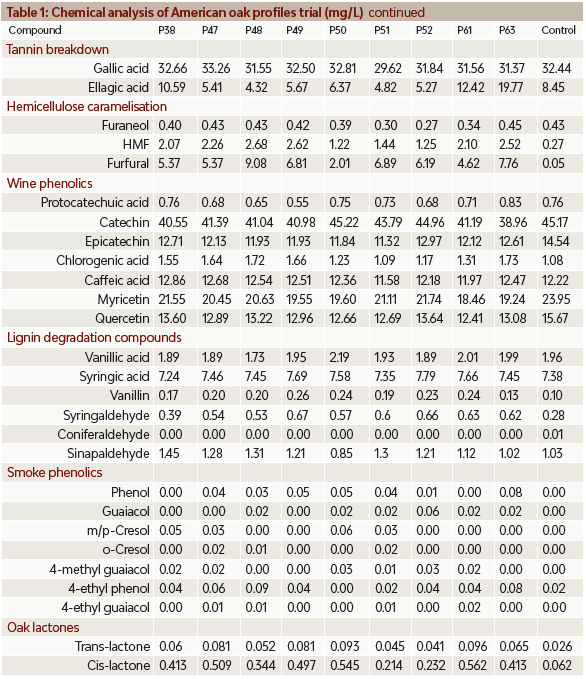
Results are in parts per million (mgL-1) on an ‘as-is’ basis. If a ‘0’ is quoted, this means less than the limit of detection. This may be assumed to be less than 0.01 parts per million.
Because Table 1 shows only numbers and it is easier to visualize chemical concentrations in bar charts, the bar charts of the most relevant chemical markers will be discussed after explaining the sensory results.
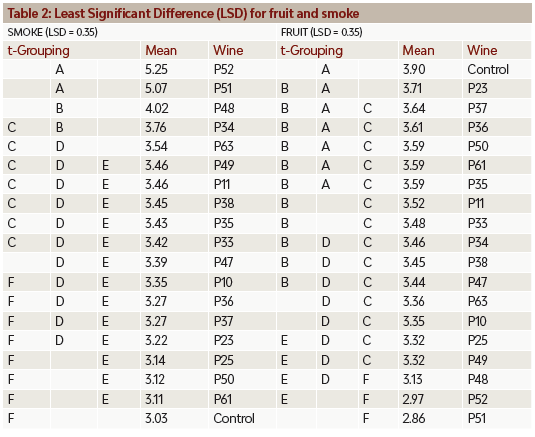
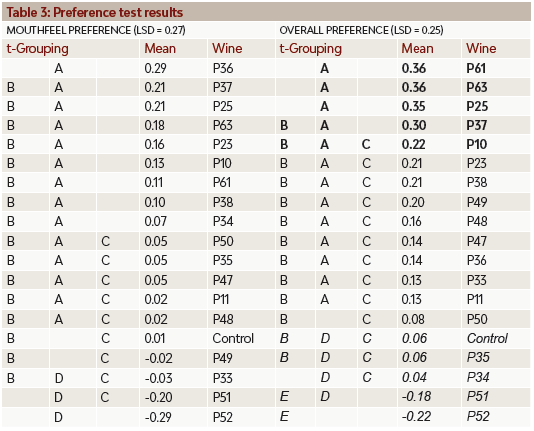
Table 3 shows that almost all variables have positive scores for overall preference, so the majority of them were somewhat liked. Because the panel was focused on finding small differences, five profiles are indicated in bold as the most preferred and five are indicated in italics as the least preferred. At this point, the panel was evaluating each profile individually as a finished wine, but in reality some of the least preferred profiles have very strong characteristics in one attribute that could make them unique for blending purposes. Mouthfeel and overall preferences were both statistically significant and the LSDs show what group of barrels was significantly different from the rest.
At this point we will examine the data plots of the toasting profiles to see if a correlation to the sensory data exists.
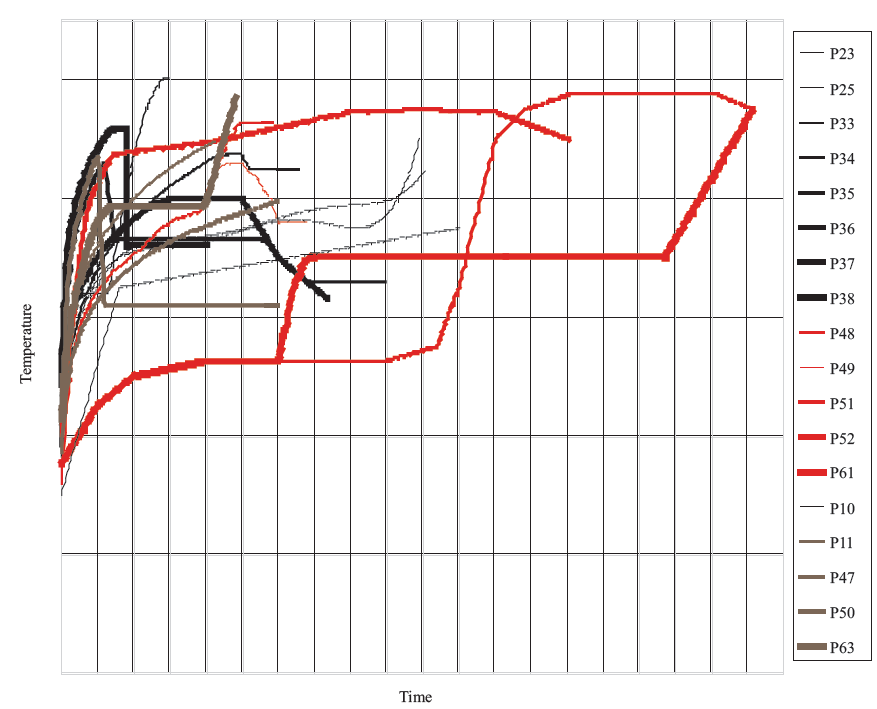
Profile Graph 1. Comparison of all the toasting profiles in the data set
Profile Graph 1 shows the data plots for all of the toasting profiles in the data set of the experiment. To better evaluate if a relationship exists with the sensory data, we will graph only those profiles at the opposite extremes of the sensory results.
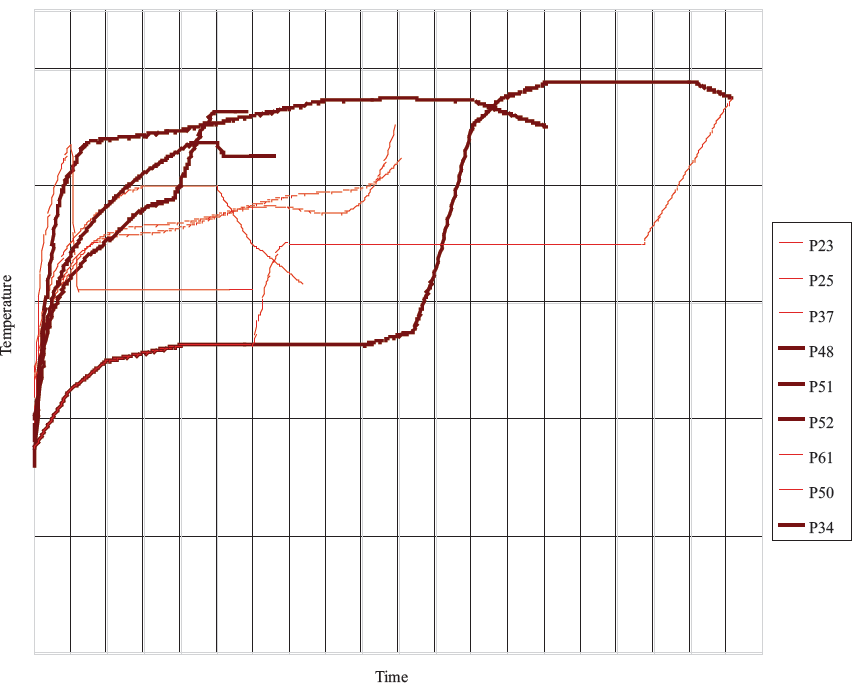
Profile Graph 2. Comparison of toasting profiles 34, 48, 51, 52 versus 23, 25, 37, 50, 61
Profile Graph 2 plots the data points of the toasting profiles for the top four profiles that were perceived with the highest amount of smoke character (P34, P48, P51, and P52). These have been highlighted in black. It also plots the five toasting profiles with the perceived least amount of smoke character (P23, P25, P37, P50, and P61) and these have been highlighted in grey. This graph shows that the perceived smokier toasting profiles were all toasted, during some point, at temperatures above 400 degrees Fahrenheit for a modest to long time period. By contrast, the toasting profiles with the least perceived amount of smoke character were toasted at temperatures mostly below 400 degrees Fahrenheit, excluding perhaps a very brief time.
It is not surprising to see a similar conclusion when we graph the toasting profiles at the opposite extremes of the sensory data for the fruit characteristic.
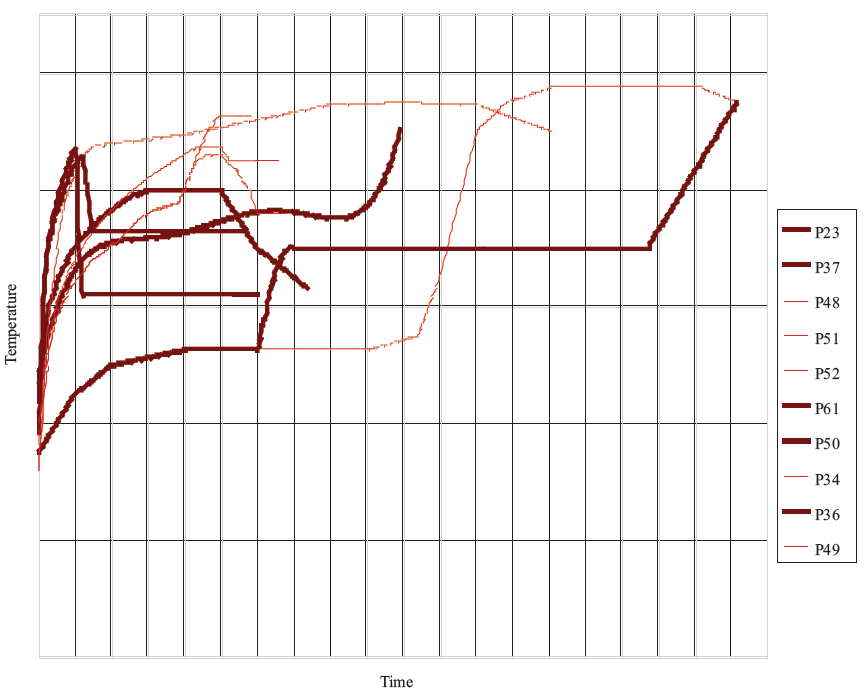
Profile Graph 3. Comparison of toasting profiles 34, 48, 49, 51, 52 vs. 23, 36, 37, 50, 61
Profile Graph 3 plots the data points of the toasting profiles for the top five profiles that were perceived as showing the most fruit character (P23, P36, P37, P50, and P61) excluding the control. These have been highlighted in black. It also plots the five toasting profiles with the perceived least amount of fruit character (P34, P48, P49, P51, and P52) and these have been highlighted in gray. This graph demonstrates that the toasting profiles with the least perceived fruit character were all toasted, during some point, at temperatures above 400 degrees Fahrenheit for a modest to long period of time. By contrast, the toasting profiles with the most perceived amount of fruit character, excluding the control, were toasted at temperatures mostly below 400º Fahrenheit, excluding perhaps a very brief time.
Since we have stated that amongst the preferred profiles in the experiment there is a negative correlation with smoke and a positive correlation with fruit, then it is again of little surprise that we find a similar conclusion when we graph the toasting profiles at the opposite extremes of the sensory data for the preferred toasting profiles.
Profile Graph 4. Comparison of toasting profiles 34, 35, 51, 52 versus 10, 25, 37, 61, 63
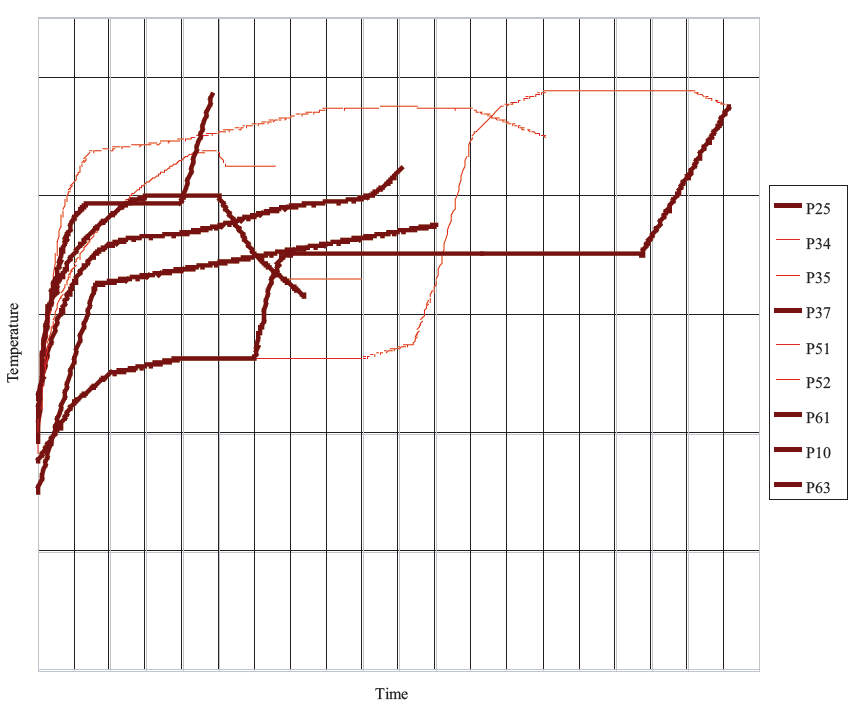
Profile Graph 4 plots the data points of the toasting profiles for the top five profiles that were preferred in the data set (P10, P25, P37, P61, and P63) and these have been highlighted in black. It also plots the four toasting profiles that were the least preferred in the data set (P34, P35, P51, and P52) and these have been highlighted in gray. It is of note that the control was amongst the top five least preferred samples in the experiment. This graph demonstrates that the least preferred toasting profiles were all toasted, during some point, at temperatures above 400 degrees Fahrenheit for a modest to long period of time, excluding Profile 35. Once again, the least preferred barrels included the control which was not significantly influenced by characters from the toasting process. By contrast, the most preferred toasting profiles were toasted at temperatures mostly below 400 degrees Fahrenheit, excluding perhaps a very brief amount of time.
Figure 1. Principal Component Analysis (PCA) for sensory results
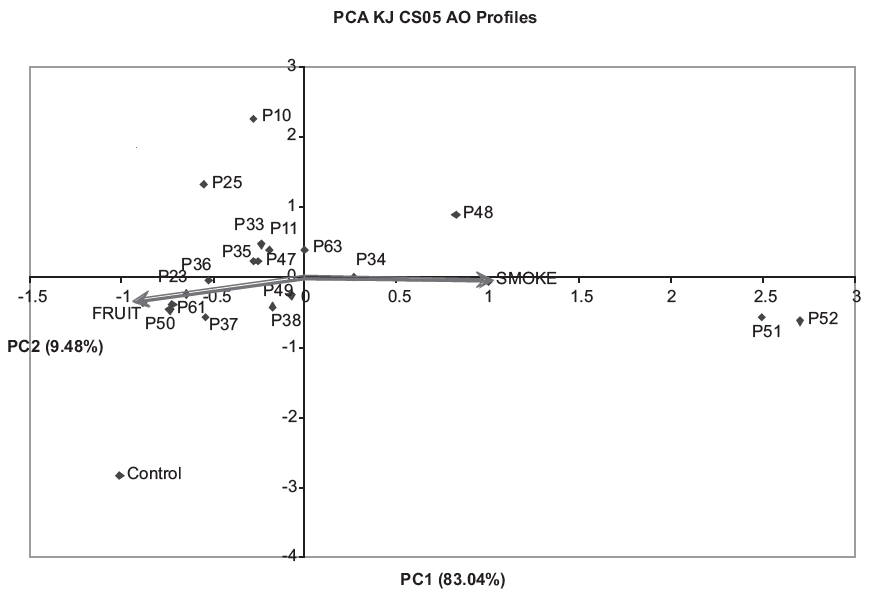
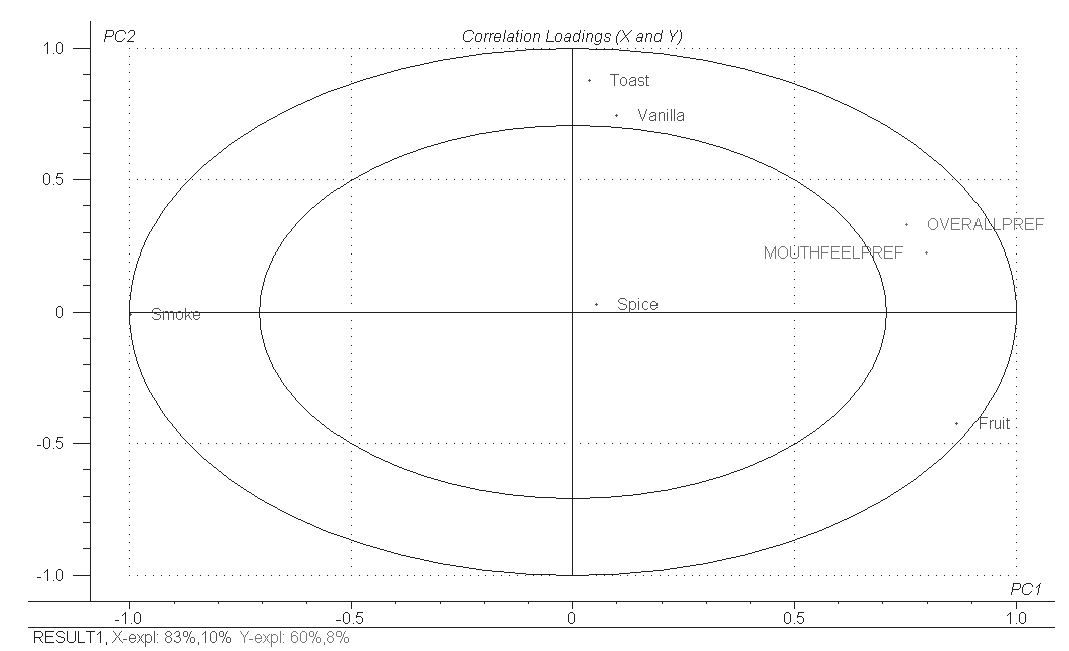
Figure 2. Partial Least Squares (PLS), Sensory and Preference Correlation Loadings
In Figure 2, even though vanilla and toasty attributes were not significant in this experiment, they did have a positive influence in the preference scores. However, the only statistically significant information is that the preference was negatively correlated to the intensity of smoke perception and positively correlated to the fruit perception.
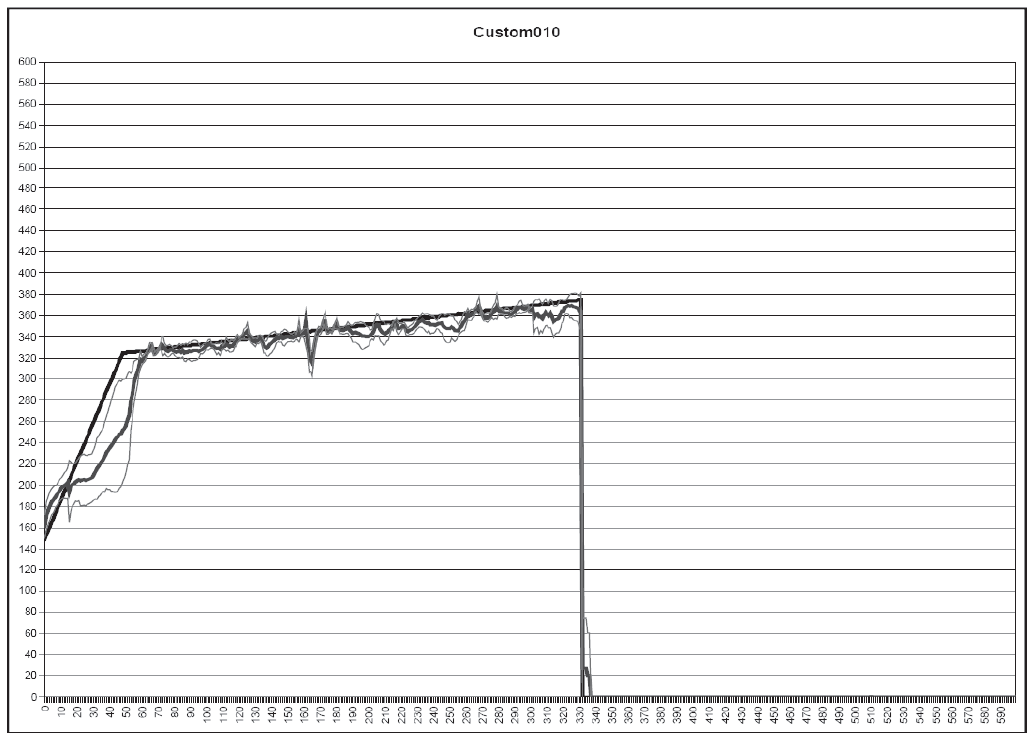
Figure 3. Toasting curves for Profile 10 with 1st Standard Deviations
| Profile Number | Stdev |
|---|---|
| 51 | 7.55 |
| 25 | 8.13 |
| 61 | 8.5 |
| 23 | 8.55 |
| 49 | 9.61 |
| 10 | 9.76 |
| 11 | 10.11 |
| 36 | 10.13 |
| 47 | 10.4 |
| 35 | 10.65 |
| 52 | 10.94 |
| 37 | 11.55 |
| 50 | 11.88 |
| 34 | 11.97 |
| 63 | 12.65 |
| 33 | 13.38 |
| 38 | 14.19 |
| 48 | 16.46 |
There are similar graphs for all the profiles used in this experiment, but we are showing only Profile 10 as an example. The information in Figure 3 is the average of the four barrels toasted following the curve of Profile 10 and the mean of the Standard Deviations of all profiles used in this experiment. Some of the larger differences during the toasting process are due to the flipping of the barrel. Because each barrel is not flipped at the same exact time, this can have a significant influence on the standard deviation. It appears from Figure 3 that Profile 10 was followed to within an acceptable range of time and temperature.
The similarity (or extent of difference between particular barrels / wines) in their chemical analysis can be shown by a multivariate projection technique such as Principal Components Analysis (PCA). Figure 4 shows the major differences between the American oak profile wine barrel types. In fact, this chart accounts for about 60% of the information contained in analysis (the addition of horizontal and vertical axes). Inspection of the remainder of the information in the chemical analysis did not reveal any other significant findings.
Figure 4. Principal Components analysis of the chemical analysis from the American oak profiles
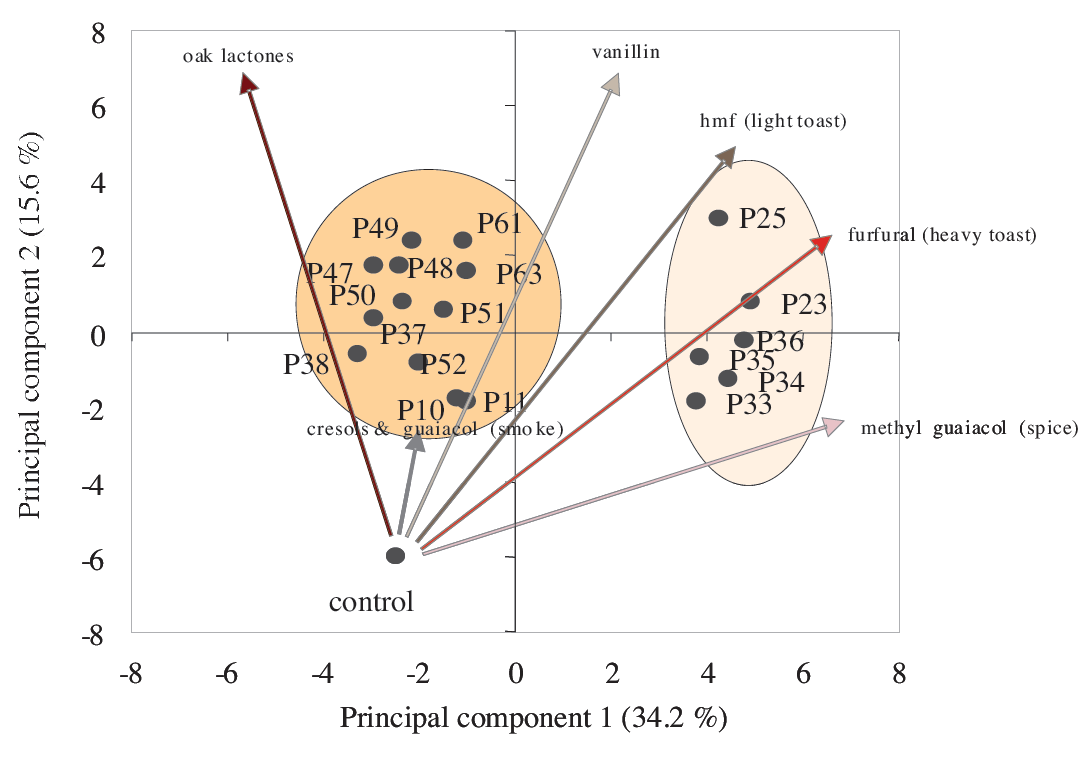
Inspection of Figure 4 shows that the control sample is very different from all the profile samples. It lies in a very different region of the chart compared to all the other samples. The diagram also suggests that the profiles are split into two groups, one lying to the left side of the chart and the other to the right side. Figure 4 also shows (as arrows – vectors) several of the chemicals that were analyzed and how they affect the samples. Thus, the cluster on the left side seems to be influenced mainly by the oak lactones and the cresols plus guaiacol, i.e. smoke. By contrast the cluster on the right side is associated with toast (hmf and furfural) and spice (4-methyl guaiacol). The important chemical vanillin appears to straddle the two clusters.
Figure 5 shows the vanillin levels in all the samples. It overlaps the two clusters because the amounts, while varying from one barrel to another, are basically about the same average value. Within each group, however, vanillin reaches its highest level in Profile 49 and is also high in profiles 50 and 52 (left cluster) as well as Profile 23 in the right cluster.
The lowest levels of vanillin occur in profiles 10 and 11. In these wine samples they average around 0.1 ppm which is enough to add flavor complexity without giving an obvious vanillin aroma and leaving other aspects of the barrels to create their unique character.
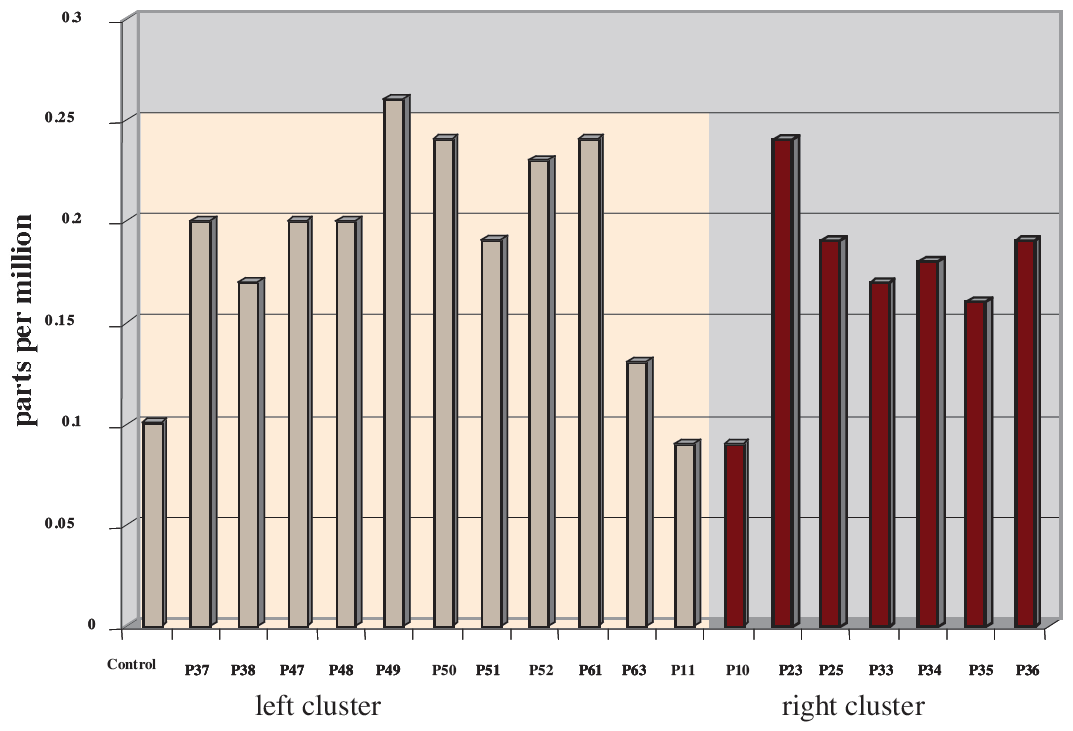
Figure 5. Vanillin content in the wines from all the barrel profiles
The most obvious feature of the left cluster seems to be the lactone content. Figure 6 shows the amounts that are present in the wines. The merest glance at Figure 6 clearly illustrates that lactones are higher in most of the left hand side cluster. However, there are exceptions. Accordingly, it may be helpful to make the point here that the location of each sample is dependent upon all of the chemicals measured in the wine. Therefore in some cases there may be samples that lie in a cluster that is apparently dominated by one particular chemical but nevertheless contains less than other wines in the group. This is because of the content of other flavor compounds and this will be illustrated again later in this report. Oak lactones are highest in profiles 61 and 50, where the quantity present would be expected to exert a significant effect upon the wine flavor. Oak lactone is lowest in profiles 33 and 34.
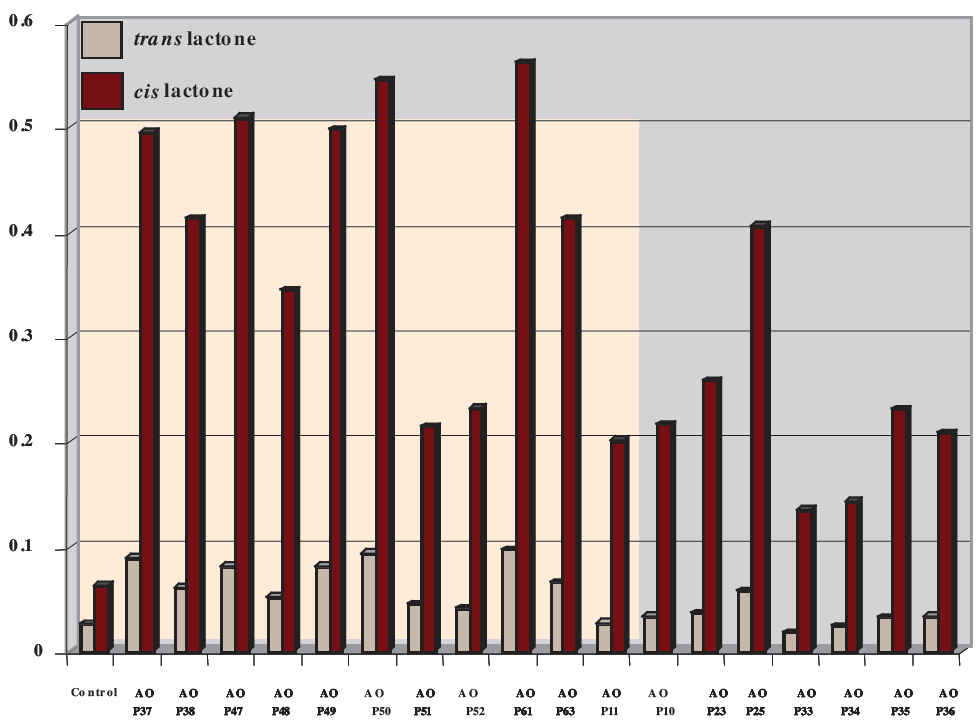
Figure 6. Oak lactone content in the wines from all the barrel profiles (cis and trans lactones)
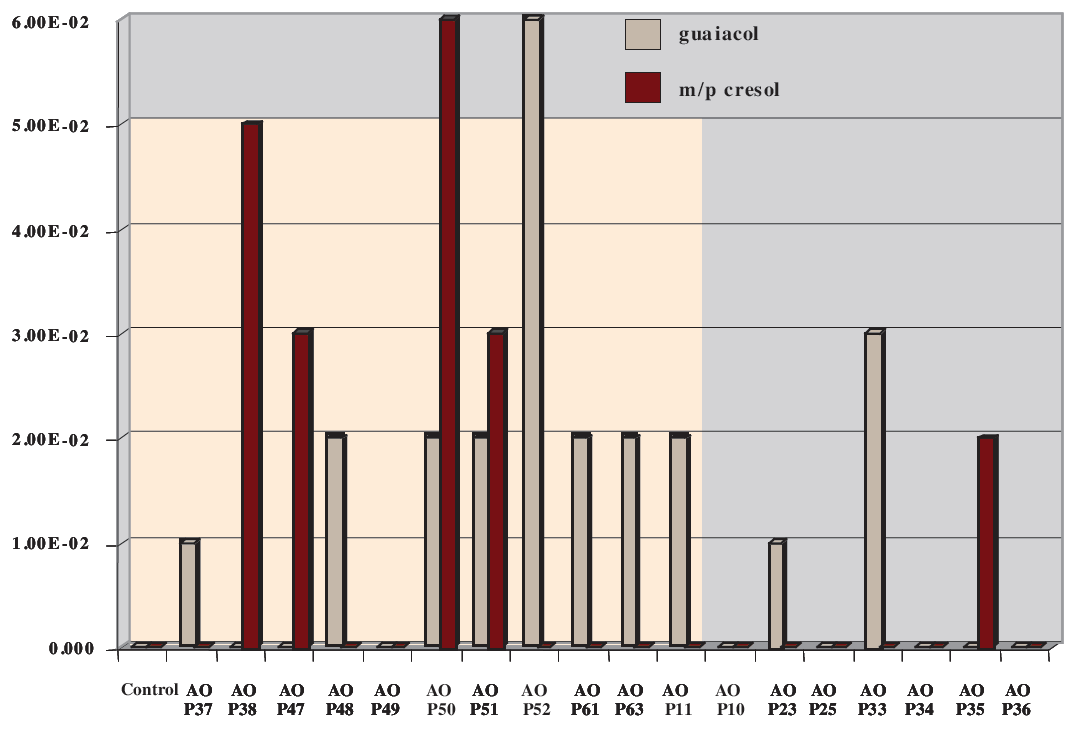
The other compounds that characterize the left cluster are smoke components, mainly m- and pcresol and guaiacol. By comparison, guaiacol can be attractive on occasions whereas the cresols are an unattractive feature in wine and are seldom likely to be sought after. Figure 7 shows the relative amounts of cresols and guaiacol in all the samples and it clearly demonstrates that these characterize most of the profiles in the left cluster.
Figure 7. Guaiacol and meta and para cresol contents in the wines from all the barrel profiles
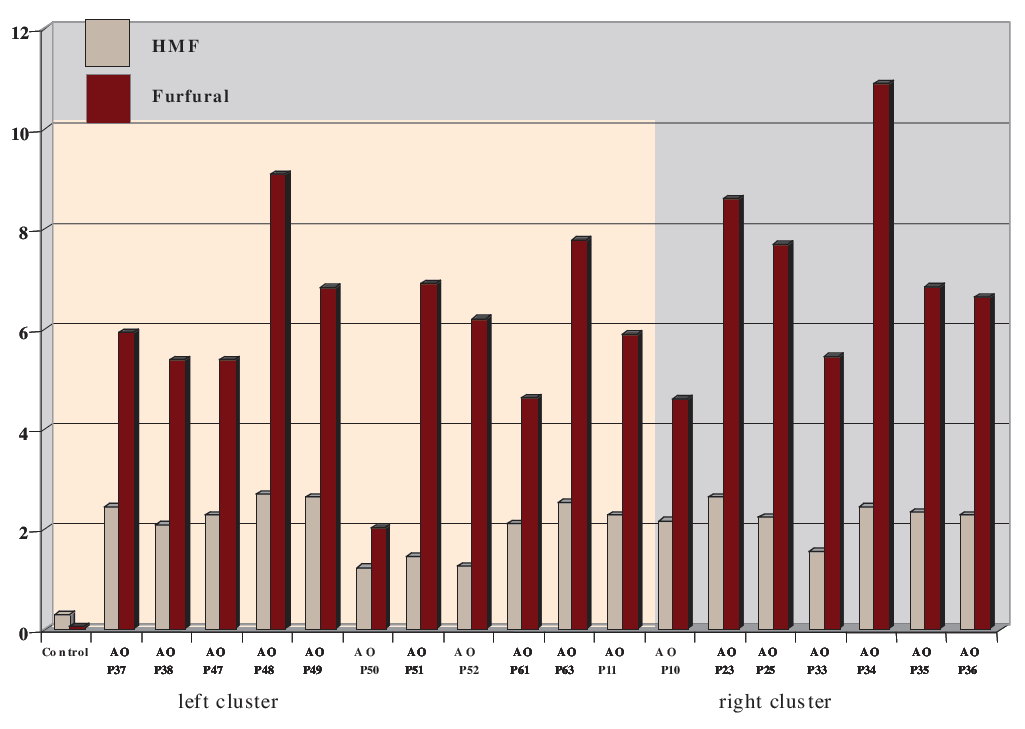
The right cluster gives the appearance of being characterized by toasted oak character.
Figure 8 shows the levels of hmf, which is 5-hydroxymethyl furfural and a marker for light cream toast. It also highlights furfural which is an excellent marker for a heavier flavor of toast.
Figure 8. Hmf and furfural in the wines from all the barrel profiles
Conclusion
Tasting Results
| Profile | Average Rank |
|---|---|
| 37 | 3.98 |
| 25 | 4.11 |
| 33 | 4.13 |
| 61 | 4.15 |
| 63 | 4.19 |
| 10 | 4.57 |
| Control | 5.18 |
| 52 | 5.49 |