The Winemaker's Guide to Barrel Evaluation:
Methodology that Links Chemical and Sensory Analysis, plus Experimental DesignDavid Llodrá
Research and Development Director
World Cooperage
Introduction
Background
For many years Cooperages 1912 has used sensor monitoring technology to develop a broad portfolio of toasting styles for winemakers around the world. Prior to 2004, technical presentations of the company’s barrel research were supported by chemical analysis of the finished experimental wines, including graphs plotting several key chemical markers to demonstrate the main differences. However, because the perception of a specific aroma in wine is not the response of a single compound, several winemakers did not completely agree with the predicted aromas and differences expected from these chemical analyses.
By the end of 2004, Cooperages 1912 and Kendall-Jackson joined forces in the establishment of an oak tasting panel of 15 winemakers to evaluate the main barrel experiments these two companies perform each vintage. David Llodrá, Research and Development Director at Cooperages 1912, in conjunction with Dr. Hildegarde Heymann from the Department of Viticulture and Enology at UC Davis, designed the initial barrel experiments and statistical methods to use for this evaluation.
Methods
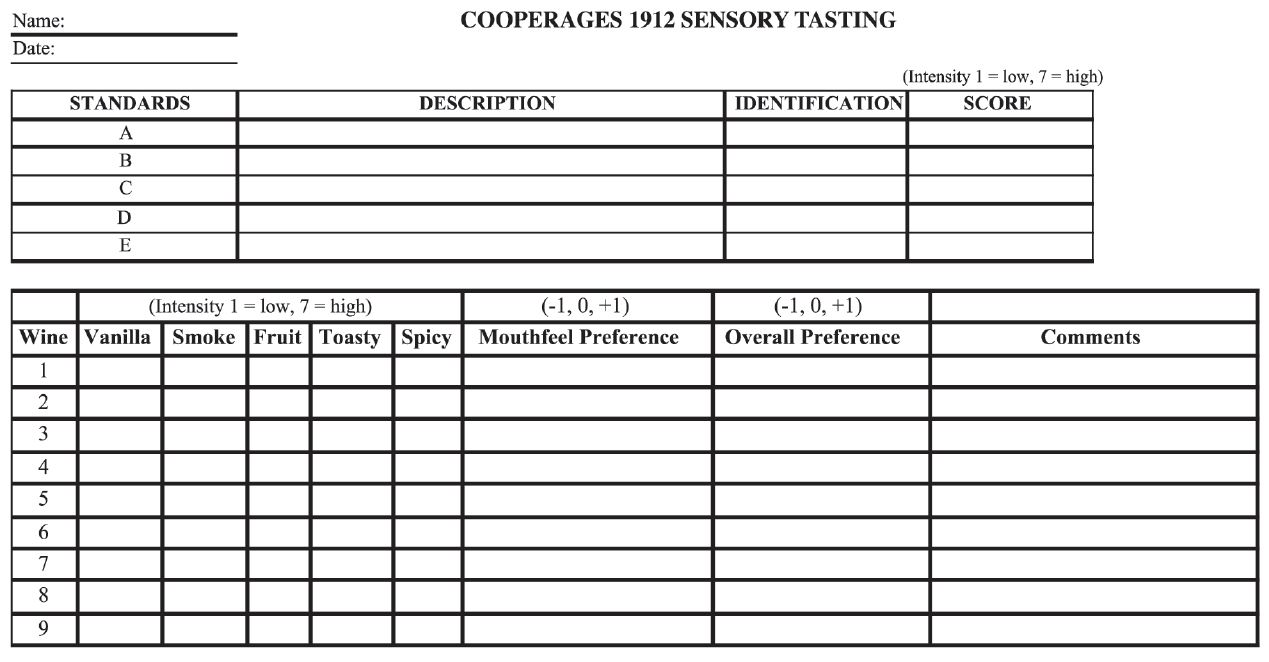
During the panel’s preliminary tasting sessions, a descriptive analysis was conducted to identify and determine the attributes that were used for the study. When the panel arrived at an agreement, five sensory attributes from oak were chosen and included: vanilla, spice, toast, smoke and fruit. Mouthfeel preference and overall preference were scored as well to help correlate the sensory attributes with preference. Also, sensory standards for each attribute were developed to assist in the training of the panel.
Each barrel experiment was designed with four to six barrels per treatment and some experiments had up to 24 treatments. A control wine made in 4-year-old barrels was included as a reference. In some cases there were more than 100 barrels in an experiment, and rackings had to be done in groups of the same treatment.
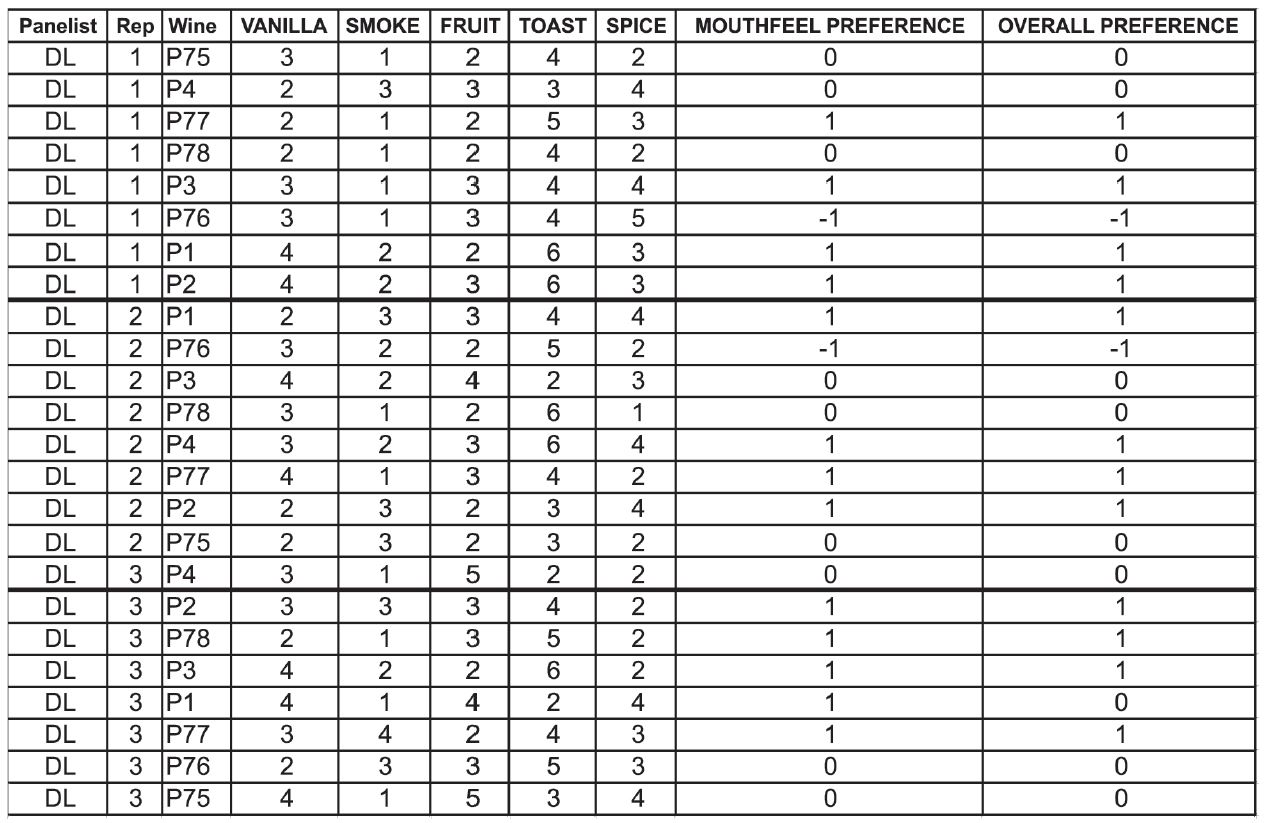
The wine samples for sensory and chemical analysis were pulled at the same time from a composite made of aliquot amounts from each barrel of the same treatment. The wine was adjusted to a free SO2 level of 30-35 mg/L. After a minimum of two weeks, the wines were chemically analyzed, and then the sensory sessions started. All tastings were blind, randomized, and done by quadruplicate so as to improve accuracy. Prior to each session, all panelists participated in a blind tasting of the sensory standards and scored each one for intensity. This practice allowed each panelist to understand his or her limitations and provided consistent training prior to the tastings. All wine samples were covered with glass covers to reduce interferences in the tasting room. High-quality sensory standards served as a very important part of the oak panel training. The list below includes the concentrations used to prepare the standards for white wines.
- Control: Chardonnay base wine
- Vanilla: 2.0 mL of vanilla extract in a 750 mL bottle
- Smoke: 150 μL liquid smoke in a 750 mL bottle
- Toast: 6.0 g of High Toast Tank Stave in a 750 mL bottle (Soaked for 2 days)
- Spice: 0.01 g of clove and 0.01 g of nutmeg in a 750 mL bottle
After completing the four sensory sessions, resulting data was processed with SAS software to calculate a three-way ANOVA for panelists, wines and repetitions. Partial Least Squares UNSCRAMBLER software was used to create a statistical analysis comparing data sets with the objective of finding positive correlations. This was accomplished by comparing two data sets at a time from the following three options: sensory descriptive analysis, chemical analysis and preference tests.
The oak tasting panel evaluated barrel experiments over a three year period. The information obtained is now crucial for barrel allocations, as the positive correlations between preference and sensory reveal the stylistic preferences of the tasting panel.
The statistical evaluation of the tasting results is presented with graphs for Principal Component Analysis (PCA), Least Significant Difference (LSD), Partial Least Squares (PLS) and Preference t est. An example of each of these graphs is presented in the following pages.
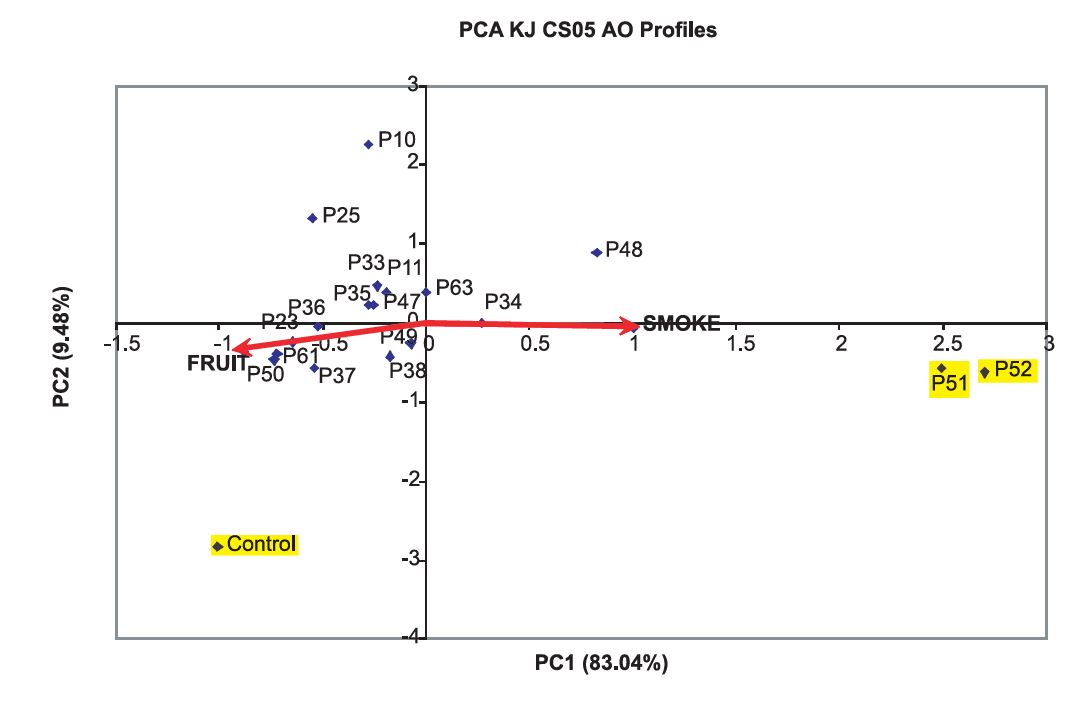
Figure 1. Principal Component Analysis (PCA) for sensory results of Barrel Profile wines
Figure 1 shows the distribution of all the barrels included in this experiment in a two dimensional space. Barrel Profiles (each representing a specific toasting curve) are indicated with a P and corresponding profile number. The only vectors plotted are fruit and smoke because they were the most significant. For the plotting of this figure, all attributes have to be considered because they had an influence, even if they were not statistically significant, but were not plotted to make the visualization easier. It is clear that the control had the most fruit and least smoke and profiles 52 and 51 had more smoke and less fruit.
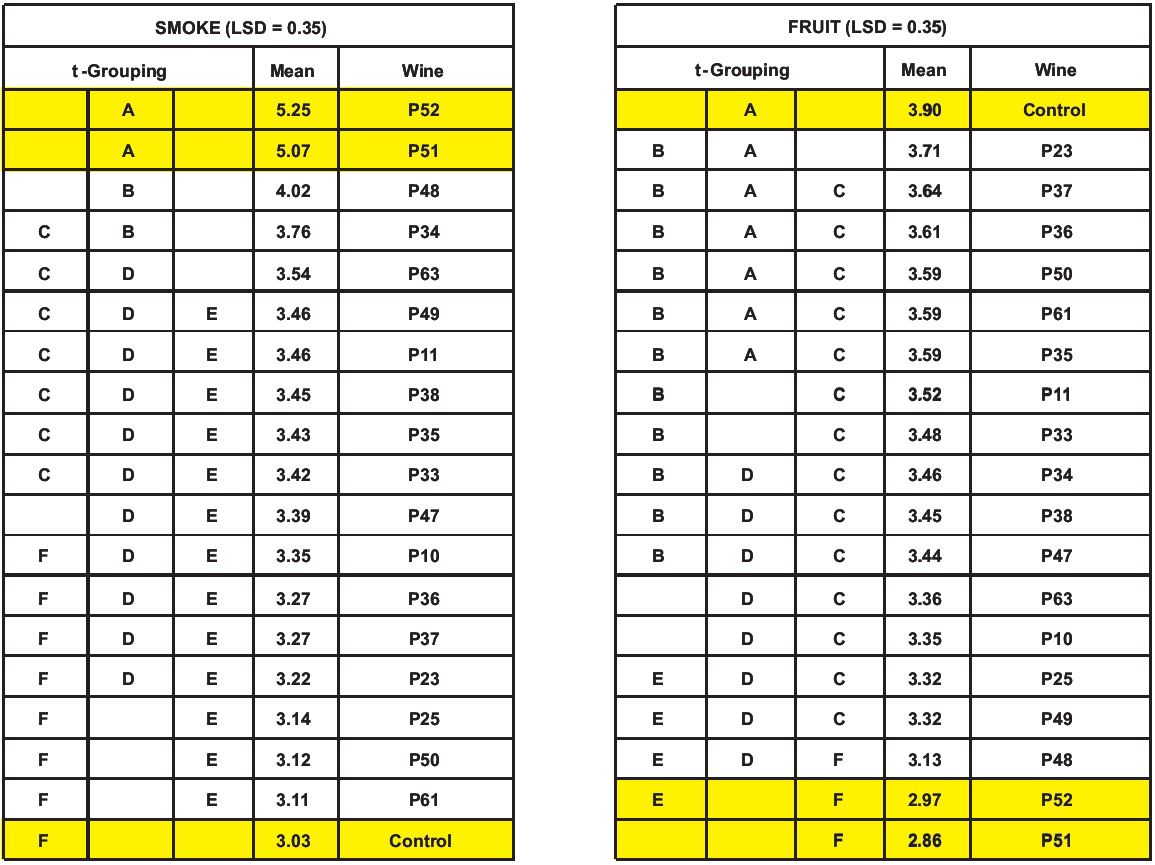
Table 1. Least Significant Difference (LSD) for fruit and smoke
Only fruit and smoke were statistically significant to the 5% level and the LSD is shown in Table 1. These results verify the tasting panel’s consistent performance because the control wine, made in used barrels from 2002, had the highest score for fruit and the lowest for smoke. All samples with the same letter in the t-Grouping column are not significantly different among them.
Figure 2. Partial Least Squares (PLS). Correlation Loadings for sensory and chemical
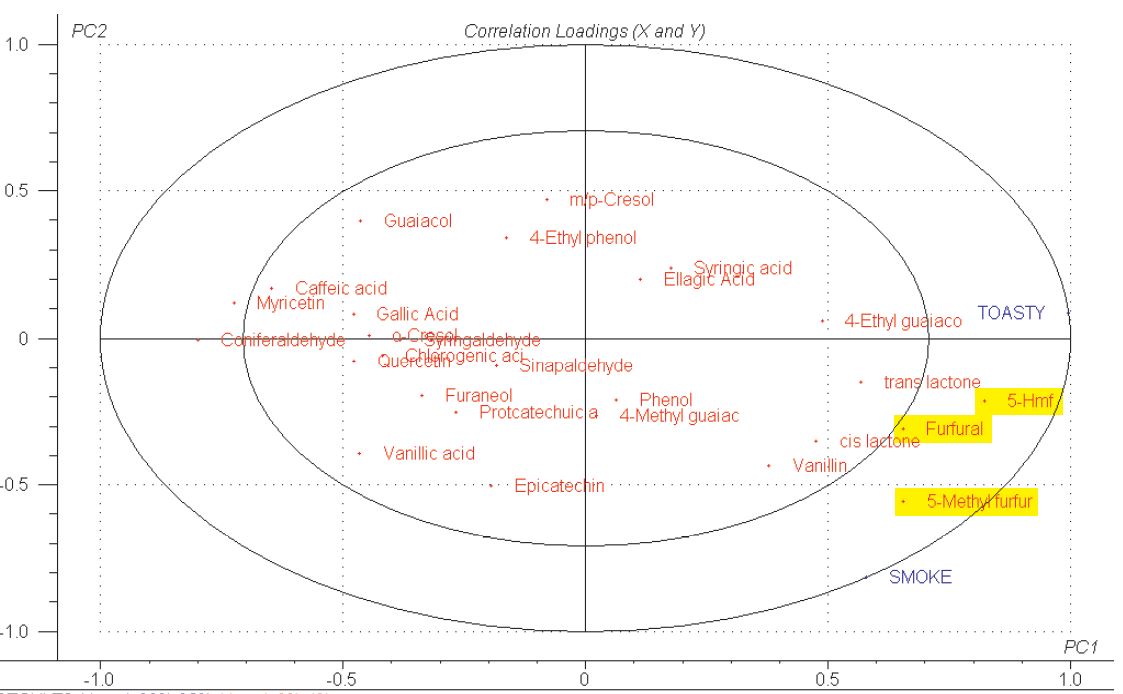
The chemical markers for toast, furfural, 5-hydroxymethyl furfural and 5-methyl furfural, are positively correlated to toasty attribute. Figure 2 shows the chemical markers for toast and the toasty attribute in the same side of the graph.There is a 68% explanation of variance for the horizontal axis.
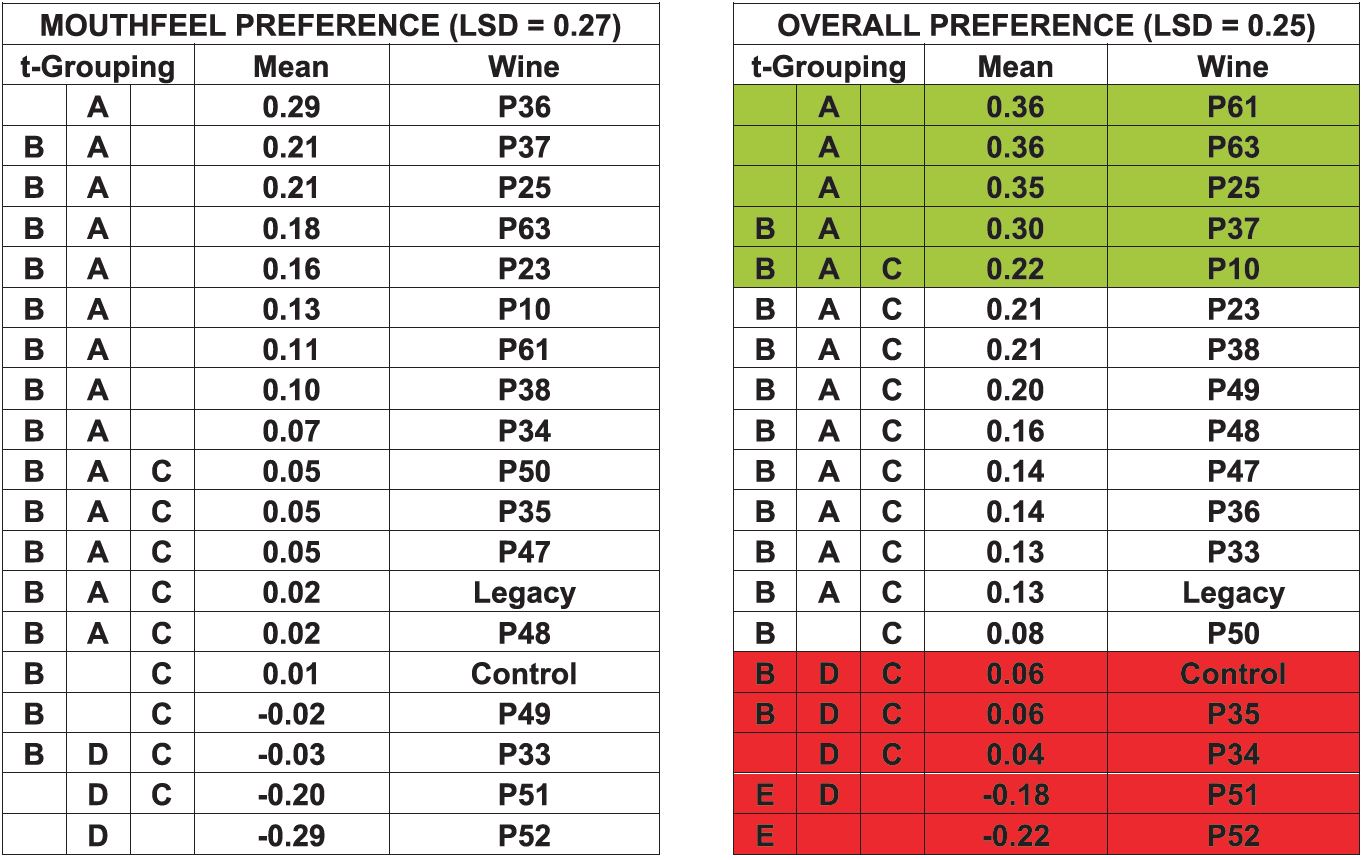
Table 2. Preference tests
Conclusion
While chemical analysis of experimental wines continues to be an important tool for barrel research, the incorporation of descriptive analysis done by quadruplicate provides better understanding of the similarities and differences among different toasting regimes. By linking sensory to chemistry, barrel research can be conducted on a much higher level.
If winemakers want to implement this method in their winery, details regarding experimental design and sensory panel training are enclosed. After completing sensory evaluation, winemakers can consult with David Llodrá, Research and Development Director at Cooperages 1912, for help processing the data and interpreting the statistics.
Experimental Design, Data Entry and Evaluation
Identify Your Goal
- Ensure your investment in terms of time and money are well spent
- A clear objective will guide your discussions with your barrel supplier
Plan the Experiment
- Oak barrel: 4 to 8 barrels per variable
- Use a control wine aged in used barrels
- Use same lot of wood
- Same wine and contact time
- Pre-determine a tasting schedule you can commit to
- Make exact composites of wine samples from same barrel type
- Bottle at the same time all the samples for sensory and chemical analysis
- Perform both analyses during the same month
Develop Oak Sensory Standards
- Minimum of 7 or 8 tasters
- Begin by performing a descriptive analysis
- All tasters taste wines and describe them
- Group all attributes from all tasters by similarity
- Look at all possible synonyms and decide the one to use by consensus
- End with less than 8 attributes
- Develop standards for each attribute
- Taste standards prior to each tasting session
- Taste blind, try to identify them and evaluate intensity of perception
- Cover glasses with caps to reduce interferences in the tasting room
Perform Chemical Analysis
- Take barrel samples
- Analyze experimental wine using GCMS for the following compounds:
- 5-Methyl Furfural
- 5-Hydroxymethyl Furfural
- Furfural
- Vanillin
- Syringaldehyde
- Coniferaldehyde
- Phenol
- Guaiacol
- m,p-Cresols
- o-Cresol
- 4-Methyl Guaiacol
- 4-Ethyl Guaiacol
- trans-Whiskey Lactone
- cis-Whiskey Lactone
Taste the Experiment
- Use a consistent scoring method
- Random order of wine for all tasters, using Latin squares software program
- Taste wines blind for a minimum of 3 repetitions, scoring each attribute using a scale from 1 to 7 (1 low, 7 high)
- Preference test using +1, 0, and -1 scores for preferred, indifferent and non-preferred respectively
Evaluate the Results
- Three way ANOVA for panelist, repetitions and samples using SAS or R software
- Least Significant Difference (LSD) of significant attributes from ANOVA using SAS or R software
- Principal Component Analysis (PCA) using SAS or R software
- Preference Test using SAS or R software
- Partial Least Squares (PLS), study of the overlap of two data sets, using UNSCRAMBLER software for Chemical, Sensory and Preference